Dashboards
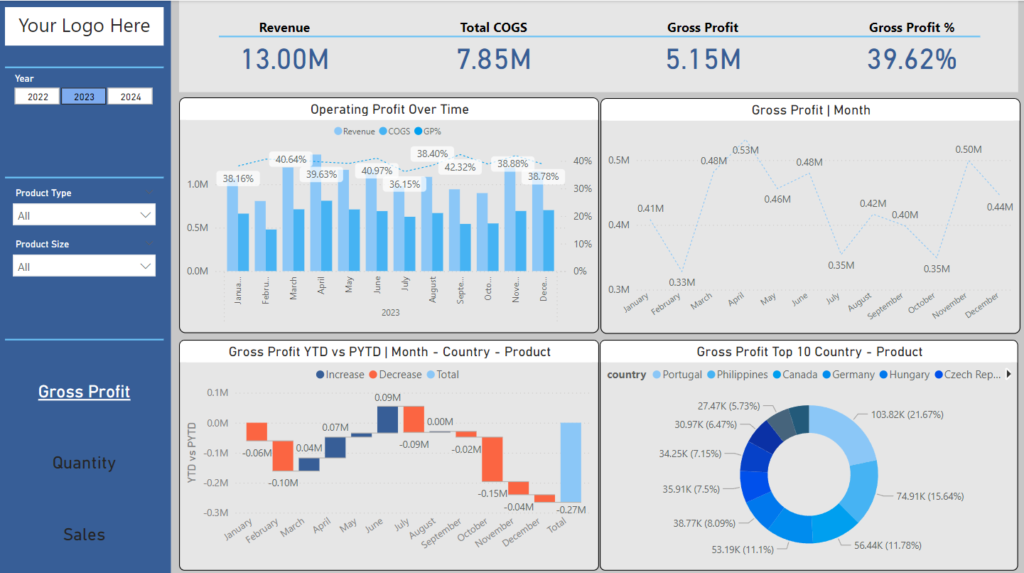
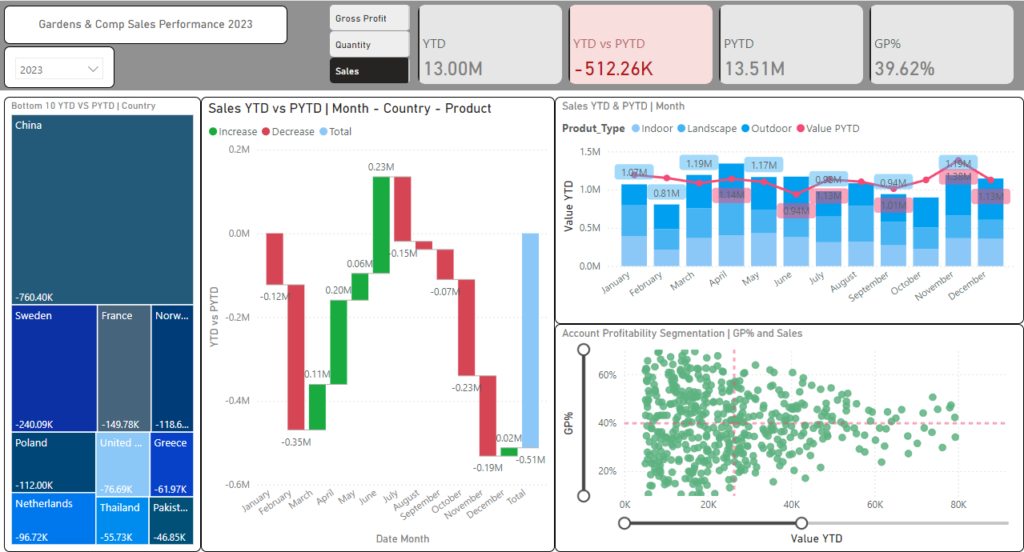
A financial dashboard is more than just charts and graphs. It’s a powerful business intelligence tool that allows you to visualize, track, and report on key financial metrics. Modern dashboards go beyond simple monitoring—they leverage financial analytics to synthesize data, uncover insights, and drive cost reduction and profitability improvement.
These reports were entirely designed and created by me.

Financial Performance
Presenting key financial metrics such as revenue, COGS, gross profit, and net profit, this dashboard includes performance over time, assets and liabilities, and G&A expenses. These components are designed to help users quickly assess financial health, track progress against goals, and identify trends for better decision-making.

Performance Report
Providing actionable insights through interactive visualizations. The report includes key metrics and trends, enabling stakeholders to make informed decisions.

KPI
Variance analysis entails comparing actual financial results to forecasts and budgets to identify discrepancies and drive corrective actions.

Risk Management
3-Statement modeling integrates the income statement, balance sheet, and cash flow statement to provide a comprehensive view of financial performance and projections.
