Performance Dashboards
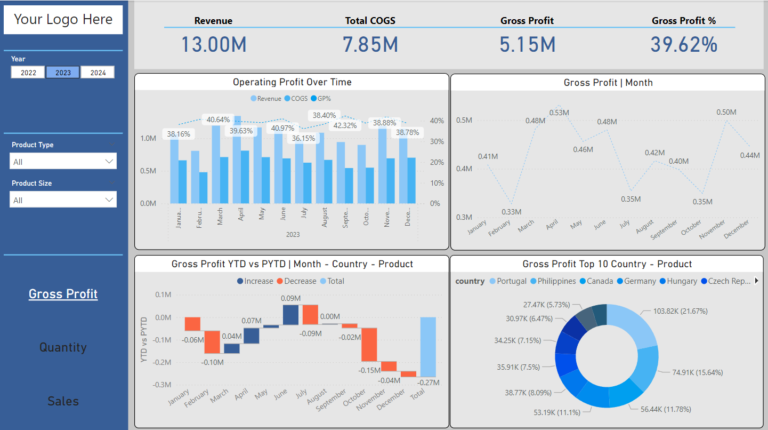
Performance Dashboards provide a clear, real-time view of key financial metrics, helping stakeholders make informed decisions quickly. They consolidate data into visual formats, enabling easy tracking of performance, identifying trends, and managing risks effectively. By simplifying complex data, these dashboards enhance strategic planning and operational efficiency.
**These are FAKE companies and numbers. Used for demonstration purposes only**
Complete Report
To create this Financial Performance Dashboard, I began by gathering and consolidating financial data from multiple sources, including revenue, expenses, and balance sheet items. I then utilized data visualization tools to design an intuitive and interactive dashboard that allows stakeholders to easily track key financial metrics such as revenue, COGS, gross profit, and net profit.
Each visual component was carefully chosen to highlight specific insights. For example, the “Operating Profit Over Time” and “Net Profit Over Time” charts provide a clear view of performance trends, while the “Assets & Liabilities” section offers a snapshot of the company’s financial position.
I also incorporated dynamic filtering options to allow users to customize the view by period, benchmark, and financial entity. This level of interactivity ensures that the dashboard is not only informative but also adaptable to different needs.
The final result is a comprehensive, user-friendly tool that enhances financial analysis and supports data-driven decision-making.

